Opening up conversation on browser interrogation tools with Browser Memory Tool Prototype
Do you sometimes feel like the browser is a black box? We are building richer and richer applications on the Web platform and this means that developers are running up against new issues to debug and test.
We feel like it is a great time to develop new tools that afford you the ability to look into the runtime to hopefully help you find a bug, or allow you to keep your application as responsive as possible.
Today we want to start a conversation about some of our thinking, with the hope that you will join in.
We have been taking a hard look at the tools landscape, and here is a presentation that gives you an idea of our thinking:
We will be posting more of our thoughts, but as you can hear, our vision for these tools is that they:
- Are able to run out-of-process. We view out of process tools as the preferred way to observe the runtime because it enables us to somewhat ignore the Heisenberg uncertainty principle. If we are profiler the browser, having to deal with NOT profiling the profiler code can be painful. Also, we want to be able to use the same tools on devices. I would much rather point my desktop tool to a Fennec device, compared to trying to use the tool on the phone itself! This leads us too…
- Enable cross browser experiences: Our lab doesn’t have the resources to develop deep integrations with multiple browsers, but we very much want to enable that. Since we are running out-of-process, we can document the communication API and many hosts can then be wired up.

The first experiment in this vein is a stand-alone memory tool prototype that lets you poke around in the JavaScript heap. What objects are there? How many of them are there? Any dangling references due to closures or event listeners?
To kick this off we worked with awesome Mozilla colleagues such as David Barron and Atul Varma which enabled us to spike down to the bare metal of the browser.
We ended up with an architecture for the tool that contains these components:
Firefox Add-on
A special Firefox add-on installs a binary component that gives us access to the low level JavaScript heap. This gives us a simple API with methods that allow you to enable profiling, get the root objects in the heap, and get detailed information on the objects themselves.
Firefox Memory Server
The current consumer of the core API is a min server. Once activated, the browser freezes and your only option to interact with it is via this server. It exposes a simple socket API with URLs mapping to the high level APIs. For example, you can access /gc-roots to get the root object ids. Or you can ask for details on an object via /objects/XXX where XXX is the object id you are inspecting. When you are done, you access /quit and the browser is unfrozen.
All of these APIs support JSONP which is how we get the data back into our main application.
NOTE: Currently, the server lives within the add-on itself (at chrome://jetpack/content/memory-profiler-server.html) but eventually this will migrated to a Jetpack.
Memory Tool Ajax Application
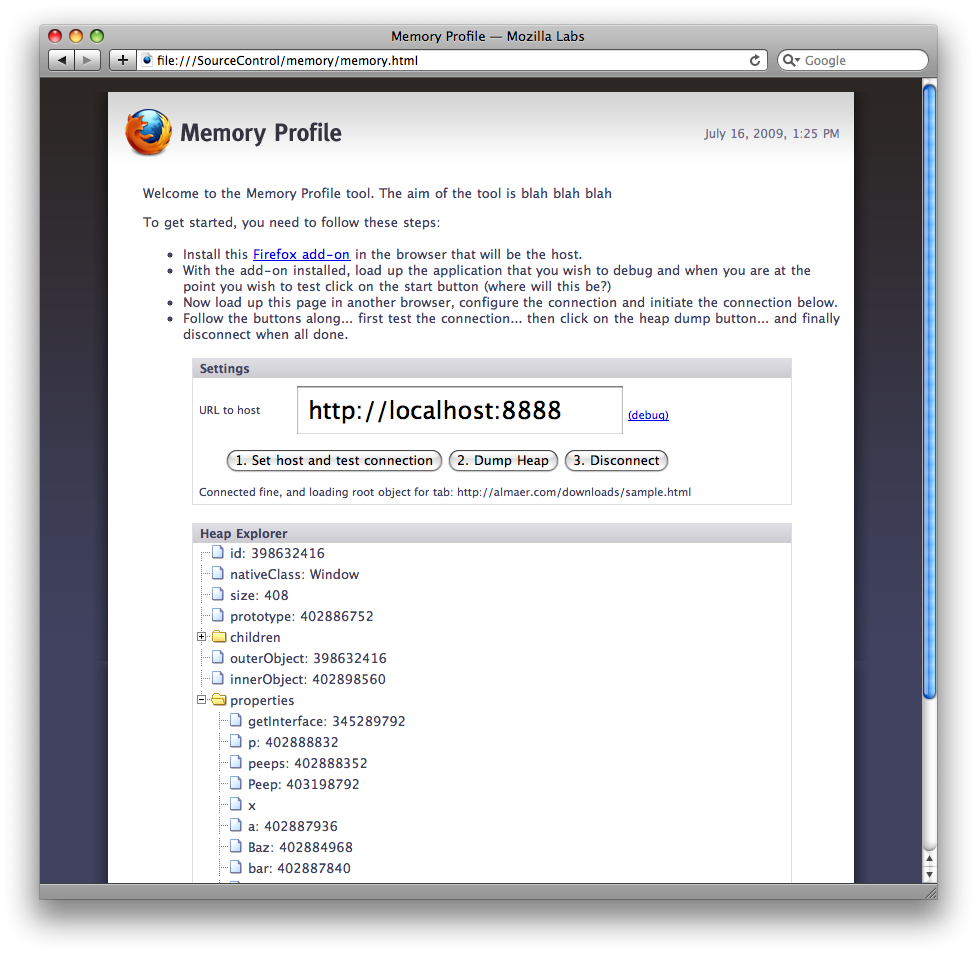
The main application itself is a simple Web application that can be run in any browser (not just Firefox!) After you have installed the Firefox Add-on, and turned on profiling via the Memory Server, you can visit the tool. Currently, after you connect, the tool gets a dump of the root object for the first tab in the browser (not including the memory server tab). You will see the meta data associated with the object, and you can click on any of the data elements that have their own memory id (memory locations are integers with 9 digits). This tree view lets you poke around the heap.
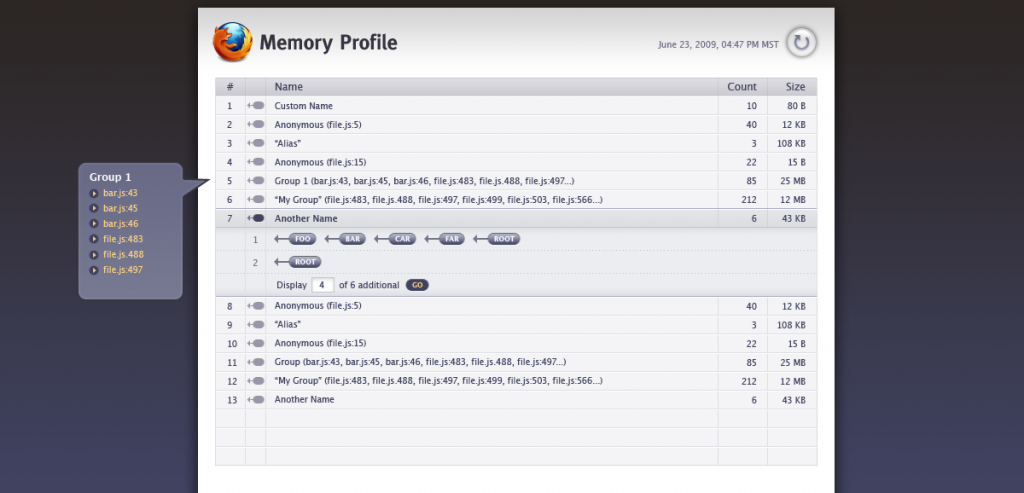
If you want to aggregate the data, you can click on the “2. Dump Heap” button, which goes through the entire heap (which can be big!) and aggregates all of the objects for you. If you see a massive number of objects of a particular type, this could be a flag!
Enough talk, lets see it briefly in action:
The tool is very early stage and changing constantly. However, it is all out in the open. You can grab the open source pieces:
As is always the case with Mozilla, and Mozilla Labs, we want to get ideas out into the community as soon as possible. This tool is very much alpha, and the goal of getting it out in the wild is to start a conversation about tools like these.
What tools in this area would help your job as a Web developer? We are all ears, and would like to share our dev tools mailing list / group as a good area to share ideas.
What about Firebug? This particular tool freezes the browser, and since Firebug is in-process right now, it wasn’t a great fit. However, we very much want to take this kind of work and get it into Firebug at some stage. We just aren’t at that stage yet!
On our side, we will be engaging with the Mozillans who truly grok the JavaScript (and entire browser) internals to see what interesting data we can expose to developers. We have found that the Firefox team has already added a lot of the infrastructure there, and now the task is to work out what will be useful, and how can we best report it.
We have plenty of ideas too. A wish list could contain:
- Short term clean up (fix the backend code that interfaces with the heap, abstract out the service into a Jetpack, and make sure we are using the correct APIs, and get these APIs added where appropriate)
- We want to visually add the graph to the object dump, so you can really understand what you are looking at. It will probably look something like this:

- We have wired up Bespin, and we will suck out the source code from functions and showing that inline to the tool itself. There is much more to do though, and we want to find out what you need.
- More profiling info: break up buckets of memory (images, js, DOM, etc)
- Great way to see who is reference whom (memory leak detection)
- Garbage Collection: When and how long are collections occuring?
- Granular filtered profiling: Profile this event and measure every event-of-interest from the start of navigation to the present e.g. DNS & TCP connections, page header parsing, resource fetching, DOM parsing, reflow, etc.
- Web Worker thread monitoring
- Have a profiling mode that gives you data without having to freaze the heap, and only when you need to do a deep dive do we get to that.
We have learned a lot as we created this prototype. Atul is going to write up his experience, and we will continue to talk in the open about how we take this prototype and your ideas to the next level with browsers.
Update
Atul has posted on his experience with SpiderMonkey and how the JS Runtime works. Nice in depth stuff. He also created PyMonkey “a Python C extension module to expose the Mozilla SpiderMonkey engine to Python.” which is crazy cool.

